Hey Reader,
On September 2, my AI visibility score read 12. Four days later, with the same tool and the same 25 prompts, it read 22.
Up 83%.
I'll admit it... I already had the screenshot cropped. It would have made a beautiful LinkedIn post.
Then a habit from my engineering years kicked in: you check the instrument before you celebrate the reading. Twenty minutes later, I had a spreadsheet which showed that my beautiful 83% was random variation. In fact, I hadn't published a single article in that window.
So I kept pulling data. I ran 40 consecutive runs across 5 months, then I measured the same brand a second way, and then I measured my entire competitor set.
The result is reported in this week’s blog post. It includes 5 assertions about AI visibility measurement, the data behind each one, and the exact calls that you can use to check every claim against your own domain.
I've spent the past year tracking which sources AI engines actually cite, and this is the first time I've published the full dataset (including the numbers that don't flatter me).
What I Cover
-
Why a single-point AI visibility score is a sample of a random process, with 40 runs of evidence (a 32% coefficient of variation, and r² = 0.00 across 5 months)
- Why 2 tools that probe the same domain in the same week can report 22 and 4, and how you should pick one
-
The difference between sampled metrics (citation scores) and counted metrics (AI Overview saturation and presence), and why your KPIs should lead with the counted ones
-
Why AI Overview saturation stopped being a differentiator (every domain in my category sits between 87.6% and 97.8%)
-
Why citation presence is the open competitive gap, with a 7x spread across competitors who look identical on every other metric
-
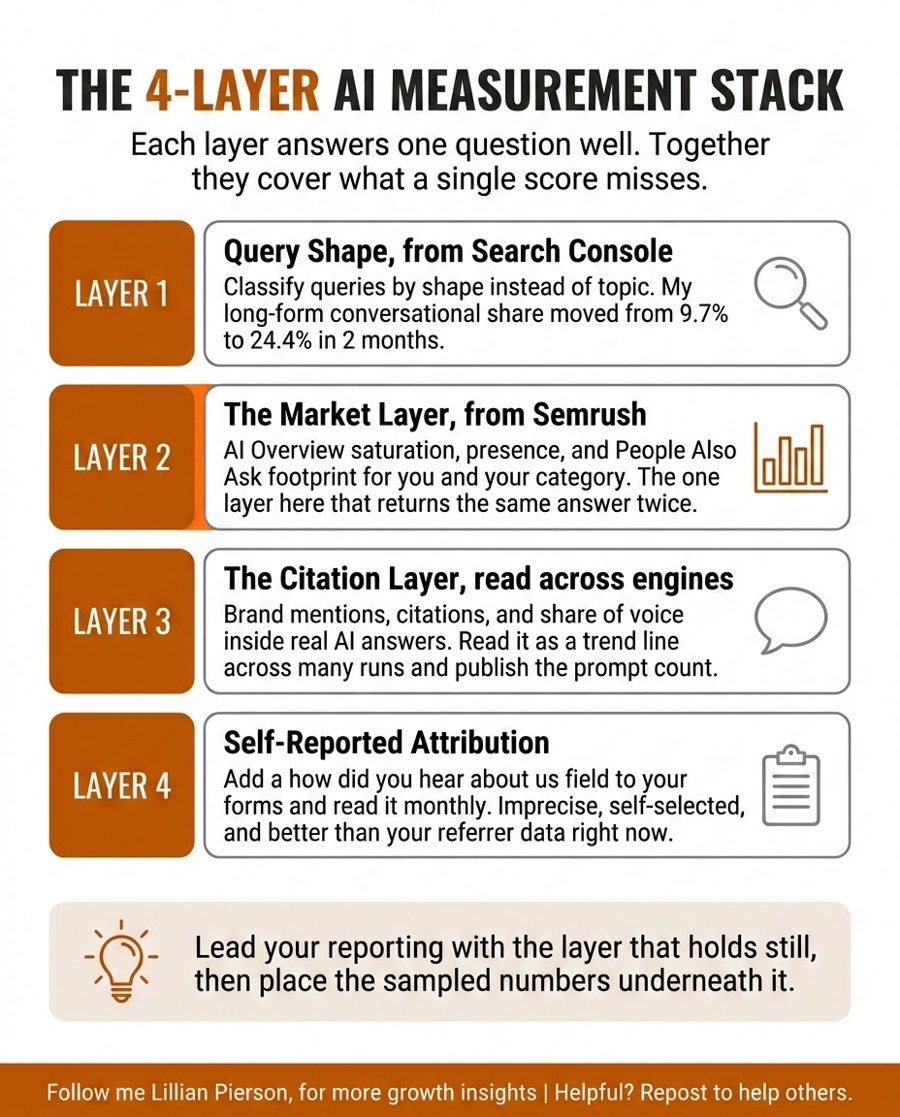
The 4-layer proxy stack that I use now that click-level attribution has collapsed, plus 5 rules for how you report AI search to your stakeholders
Referenced
-
Semrush AI Visibility Toolkit (Visibility Overview, Brand Performance, Competitor Research, Prompt Research & Tracking, AI Search Site Audit)
-
Semrush AI Search Site Audit, which I use to confirm that AI crawlers can reach your content
-
Google Search Console, which I use for the Layer 1 query-characteristics classification
- The Semrush Model Context Protocol (MCP) server connected to Claude, which is how every call in the article runs conversationally
- The Semrush reports that I used: resource_rank_history, domain_rank, domain_organic_organic, resource_organic
Where To Go Next
Biggest Takeaways
- Every AI visibility number that you've ever quoted is unverifiable until the prompt count, the window, and the variance sit beside it. Ask every vendor and every agency for the prompt count behind their score, and treat that answer as your first gate. My score averages 2 percentages over 25 prompts, so when one prompt flips, the composite moves 2 points. Four prompts moved it 10.
- When you compare your score to a competitor's published score, you get nothing usable, because the score describes the tool's prompt set as much as it describes your brand. Pick one tool, stay on it, and choose the tool that reads across multiple engines instead of just one. Independent engines drift in different directions on the same day, so the aggregate lands in a tighter distribution. A tool that reads across engines makes a more modest claim than most vendors in this category make, and it's a claim that you can actually support.
- When I separated sampled metrics from census metrics, it reorganized my reporting. A citation score is a sample, and AI Overview saturation is a census. Lead your KPIs with counted metrics, and place the sampled metrics underneath them. For the same brand, over the same window, the census metric came in at r² = 0.964 with 14% variation, and the sample came in at r² = 0.00 with 32%.
- Saturation belongs on your context slide now, and your headline belongs to a metric that actually separates you from your competitors. When every domain in the category sits between 87.6% and 97.8%, "we're exposed to AI Overviews" describes the entire category and tells your stakeholders nothing about you. The correlation between footprint size and saturation in my set was −0.13. A 3,116-keyword site and a 96-keyword site are equally covered.
- The real competitive gap sits one column to the right, in citation presence. Citation presence varies nearly 7x across competitors who have matching saturation, and it carries a margin of error of zero, which makes it the one AI search number that you can build a quarterly target on. My own split: 1,252 organic keywords, 1,208 of them on a page with an AI Overview, and 26 where I appear as a source. That puts me second from the bottom of my own category. I published my ranking anyway, because the only alternative is to pick the window that flatters me.
- The two AI Overview columns come back with identical labels, and most teams read them as a single column. serp_ai_overview_keywords counts the pages that carry an AI Overview. serp_ai_overview_positions counts the pages where you sit inside that AI Overview. Identify each column by its position in the export instead of by its header label. And always ask whether your organic keyword count shrank over the same period, because a shrinking footprint can lift saturation through arithmetic alone.
- Click-level attribution is not coming back, so stop promising it. The referrer header gets stripped before the click reaches your site, so what this category delivers is presence, trend, and competitive context. Build the proxy stack, label every proxy as a proxy, and publish your windows. Your dashboard is what earns you the meeting. Your clarity about what your dashboard counts versus what it estimates is what earns you the renewal.
This article is for you if you have to put an AI search number in front of a founder, a board, or a client, and then defend that number next quarter. The prompts I share within the article run in about 10 minutes total, and they return the whole series in one call.
Semrush sponsored the article, and the toolkit links are affiliate links. The analysis, the data, and the conclusions are all mine, and you can reproduce every figure against your own domain.
Enjoy!
All the best,
Lillian Pierson
Fractional CMO & GTM Engineer
|